You're a first-year student at Northeastern. You have an academic advisor, a co-op advisor, and — because you're in the honors program — an honors advisor. To book time with each, you open three different applications: BookMe for one, Appointment+ for another, Calendly for the third. Each requires a separate login because two of the apps are not connected to the university's identity manager.
You receive somewhere between 10 and 20 university emails a day. You're toggling between up to 44 web applications and managing multiple calendars that change depending on your college, major, concentration, and any additional programs you're enrolled in.
University leadership assumed students were simply disorganized — bad at reading emails, neglectful of deadlines.
The quantitative survey data seemed to confirm this: students were dropping the ball. But that data only measured what was happening. It didn't explain why.
My research told a different story entirely. Students valued their education deeply — particularly Northeastern's experiential learning model. They weren't disengaged. They were overwhelmed by the infrastructure itself.
Six months to evaluate a technology ecosystem serving 27,000 students across dozens of colleges, offices, and departments. I couldn't assess every tool in depth. I had to decide where to focus — and more importantly, how to frame the research to produce actionable results rather than just a catalog of issues.
Rather than evaluating individual applications in isolation — which was the expected approach — I chose to map the entire ecosystem as a system. The pain wasn't in any single tool. It was in how those tools interacted, overlapped, and siloed.
That reframing changed what the engagement could deliver: not a list of app-level fixes, but a structural diagnosis of institutional fragmentation.
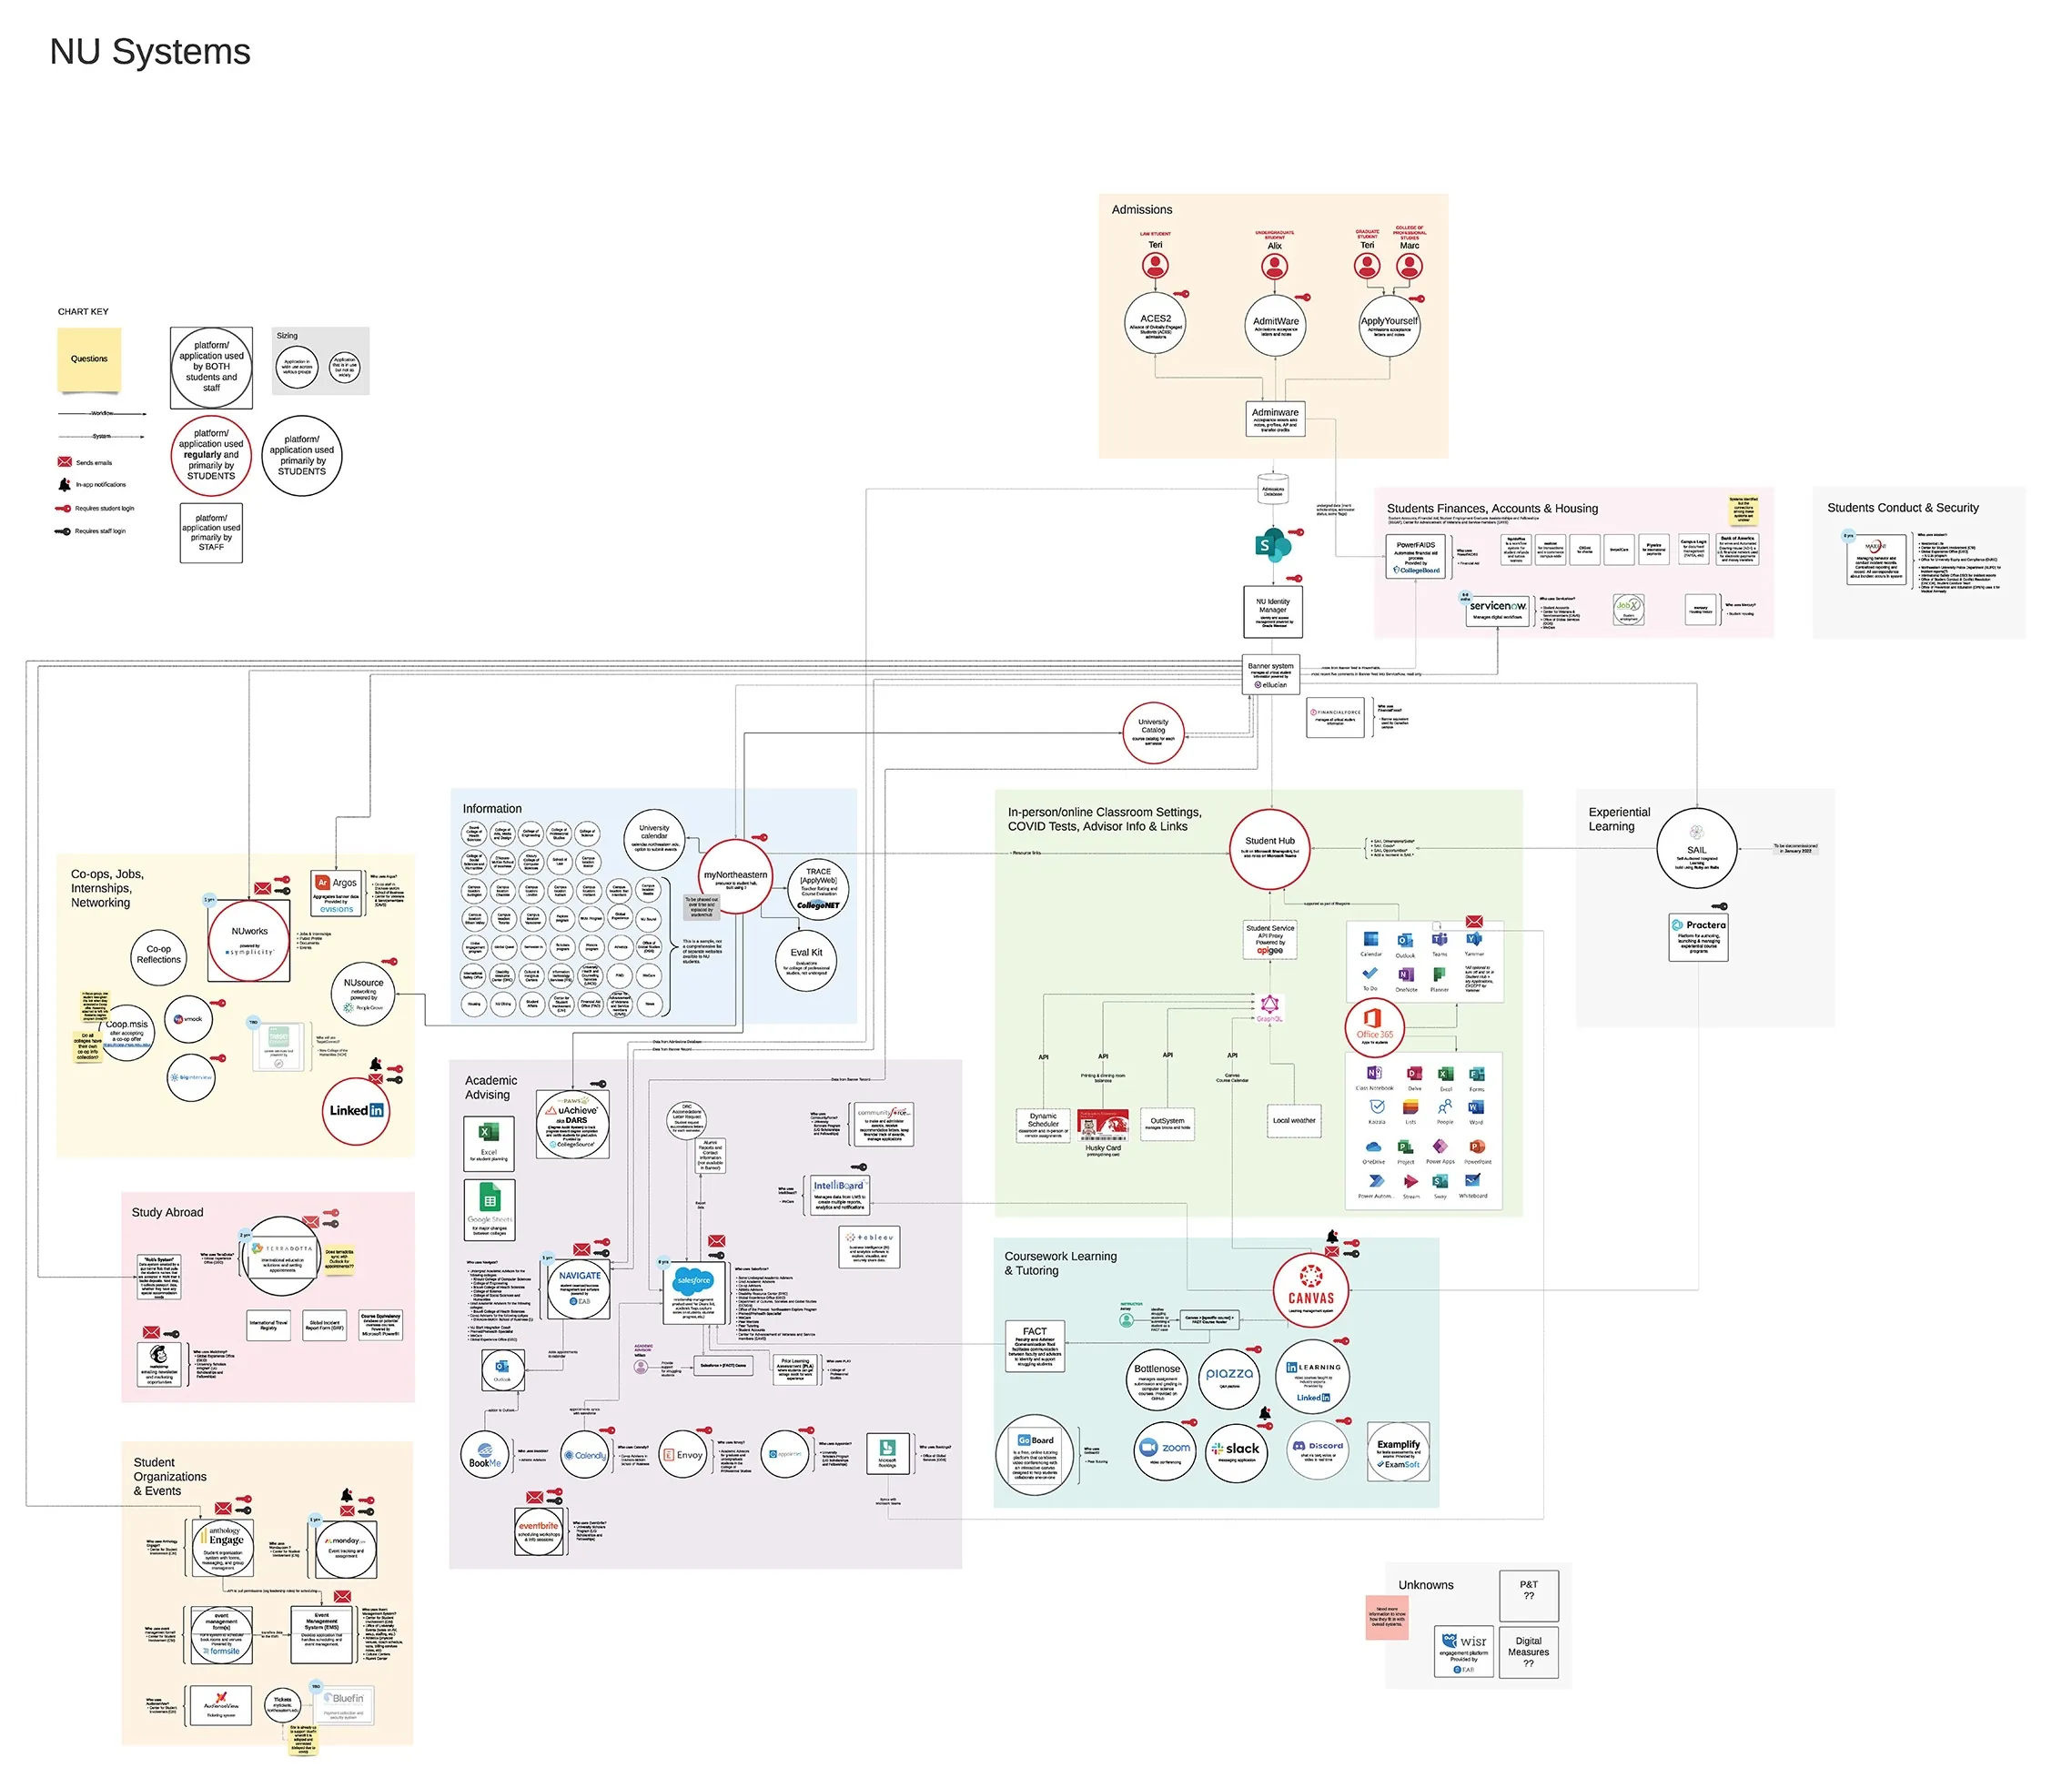
The university already had technical architecture diagrams. What it didn't have was a way for non-technical stakeholders to see how the ecosystem worked — and where it was failing students.
I built a subject matter map through iterative research: reviewing over 15 internal documents and reports, conducting student and staff interviews, running surveys, and attending a series of technology-focused meetings with application experts across the university. Each meeting added connections, revealed data flow directions, and exposed where systems were talking to each other — and where they weren't.
The map wasn't a wiring diagram. It was designed to be legible to Vice Chancellors, Deans, department heads, and support staff — anyone who would need to act on the findings.
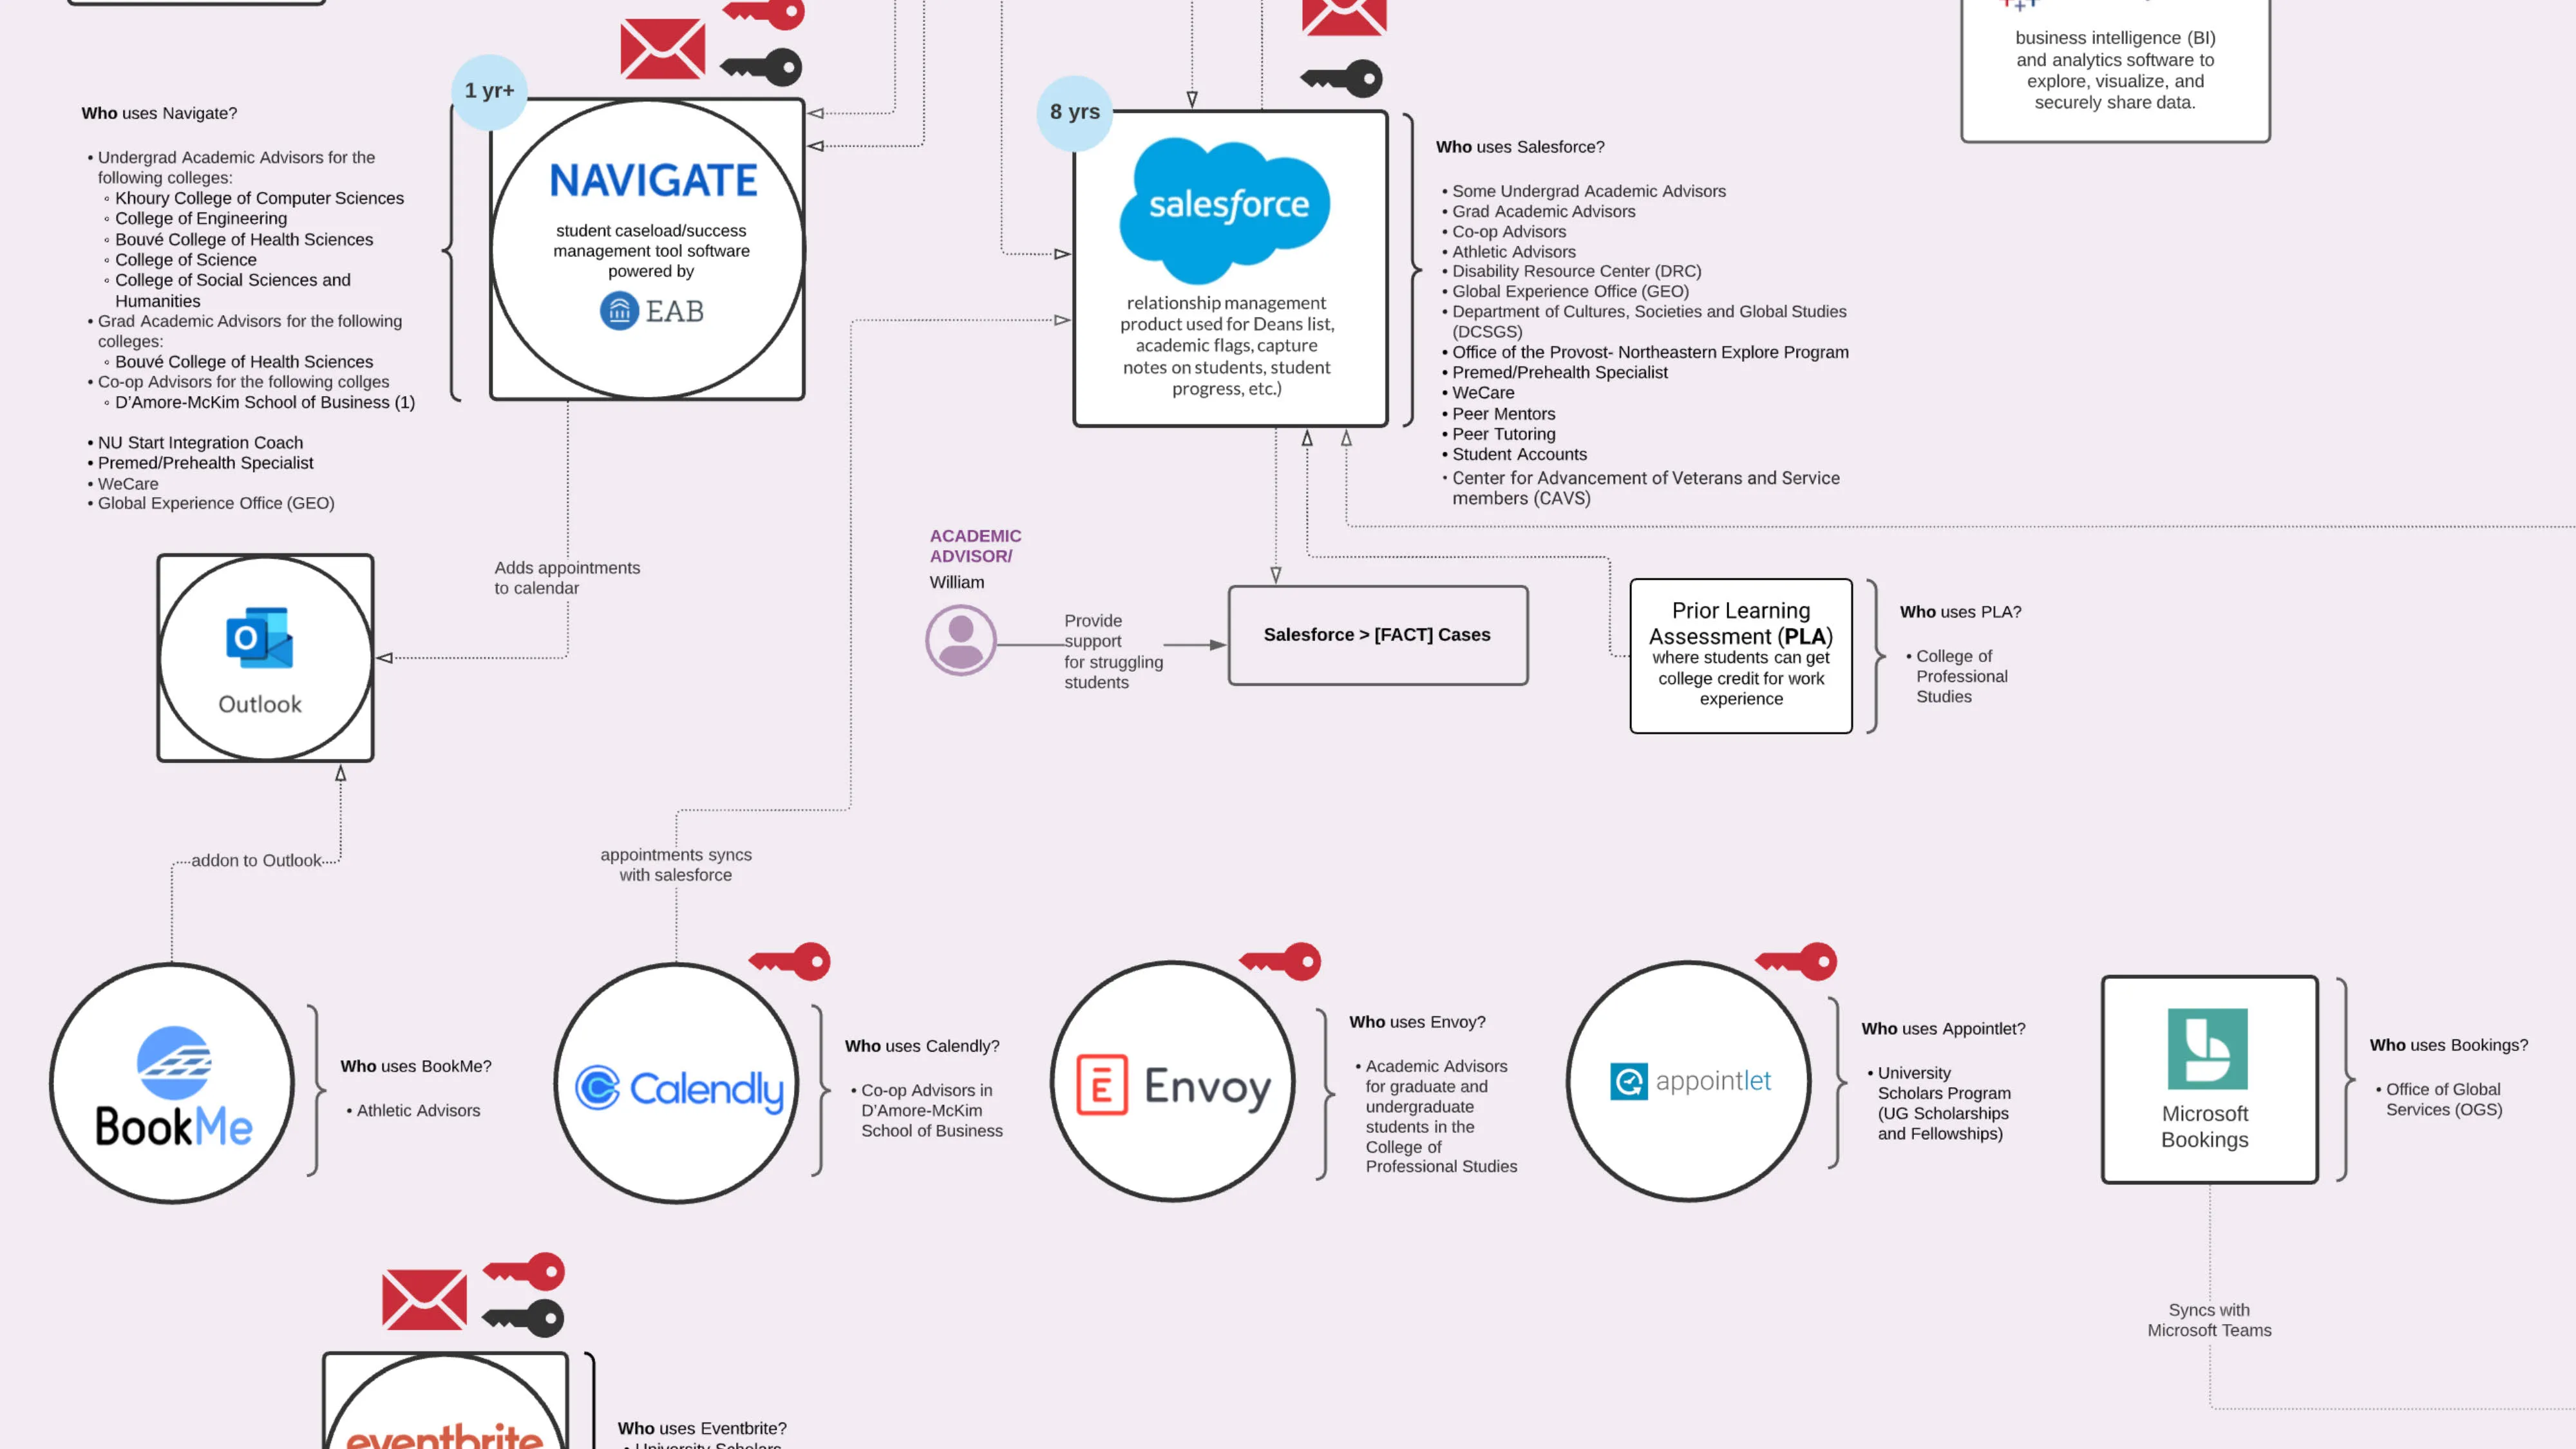
It showed which tools belonged to which functional domains, which direction data flowed between systems, and critically, which applications sat outside the university's identity manager. Those are marked with red key icons — each one representing a separate login a student had to manage.
Zooming into just the appointment scheduling cluster, the map revealed five different scheduling applications in use across departments — not including an additional advising tool that also offered scheduling.
No one had seen this fragmentation before because each department had independently chosen its own SaaS solution. The choices made sense in isolation. Viewed as a system, they were compounding student confusion.
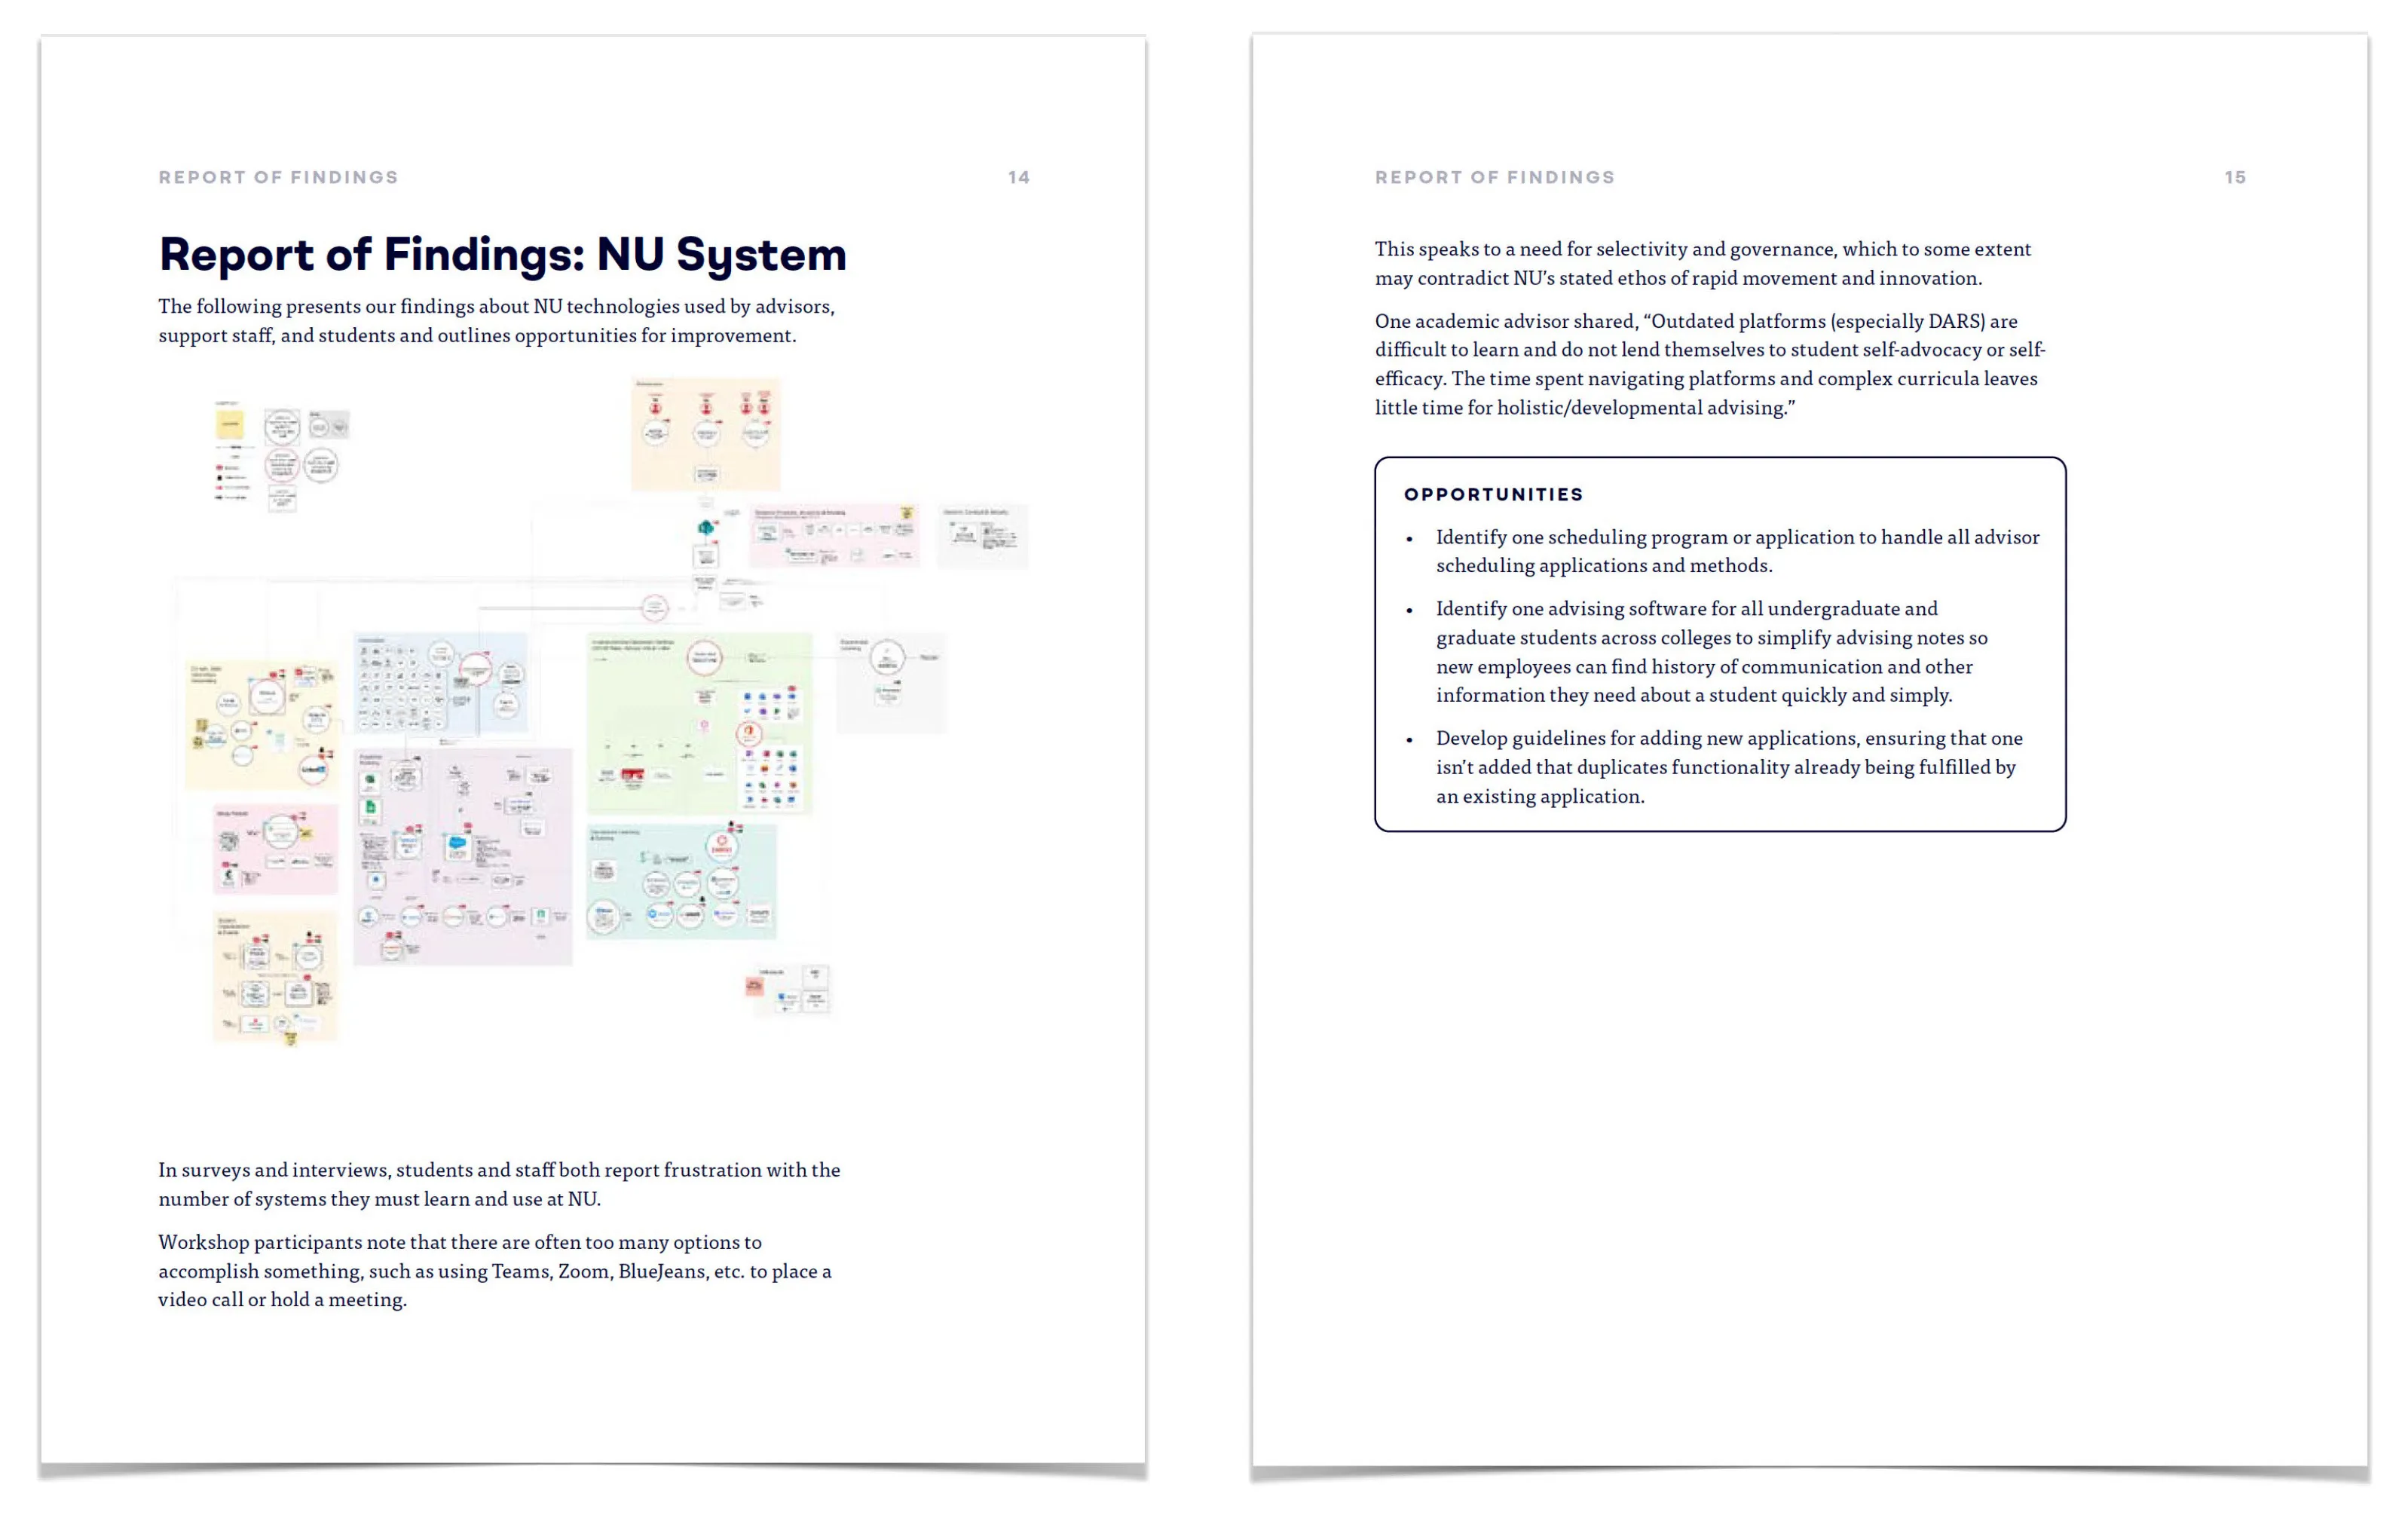
The harder challenge wasn't the research — it was the reception. My findings crossed politically charged lines. Different departments had championed different technologies. Different offices had built workflows around tools my research was now questioning. Staff who believed students were disorganized were being told, with evidence, that the institution's own infrastructure was the primary source of friction.
I needed to present findings that challenged deeply held assumptions — to stakeholders who had the authority to reject them.
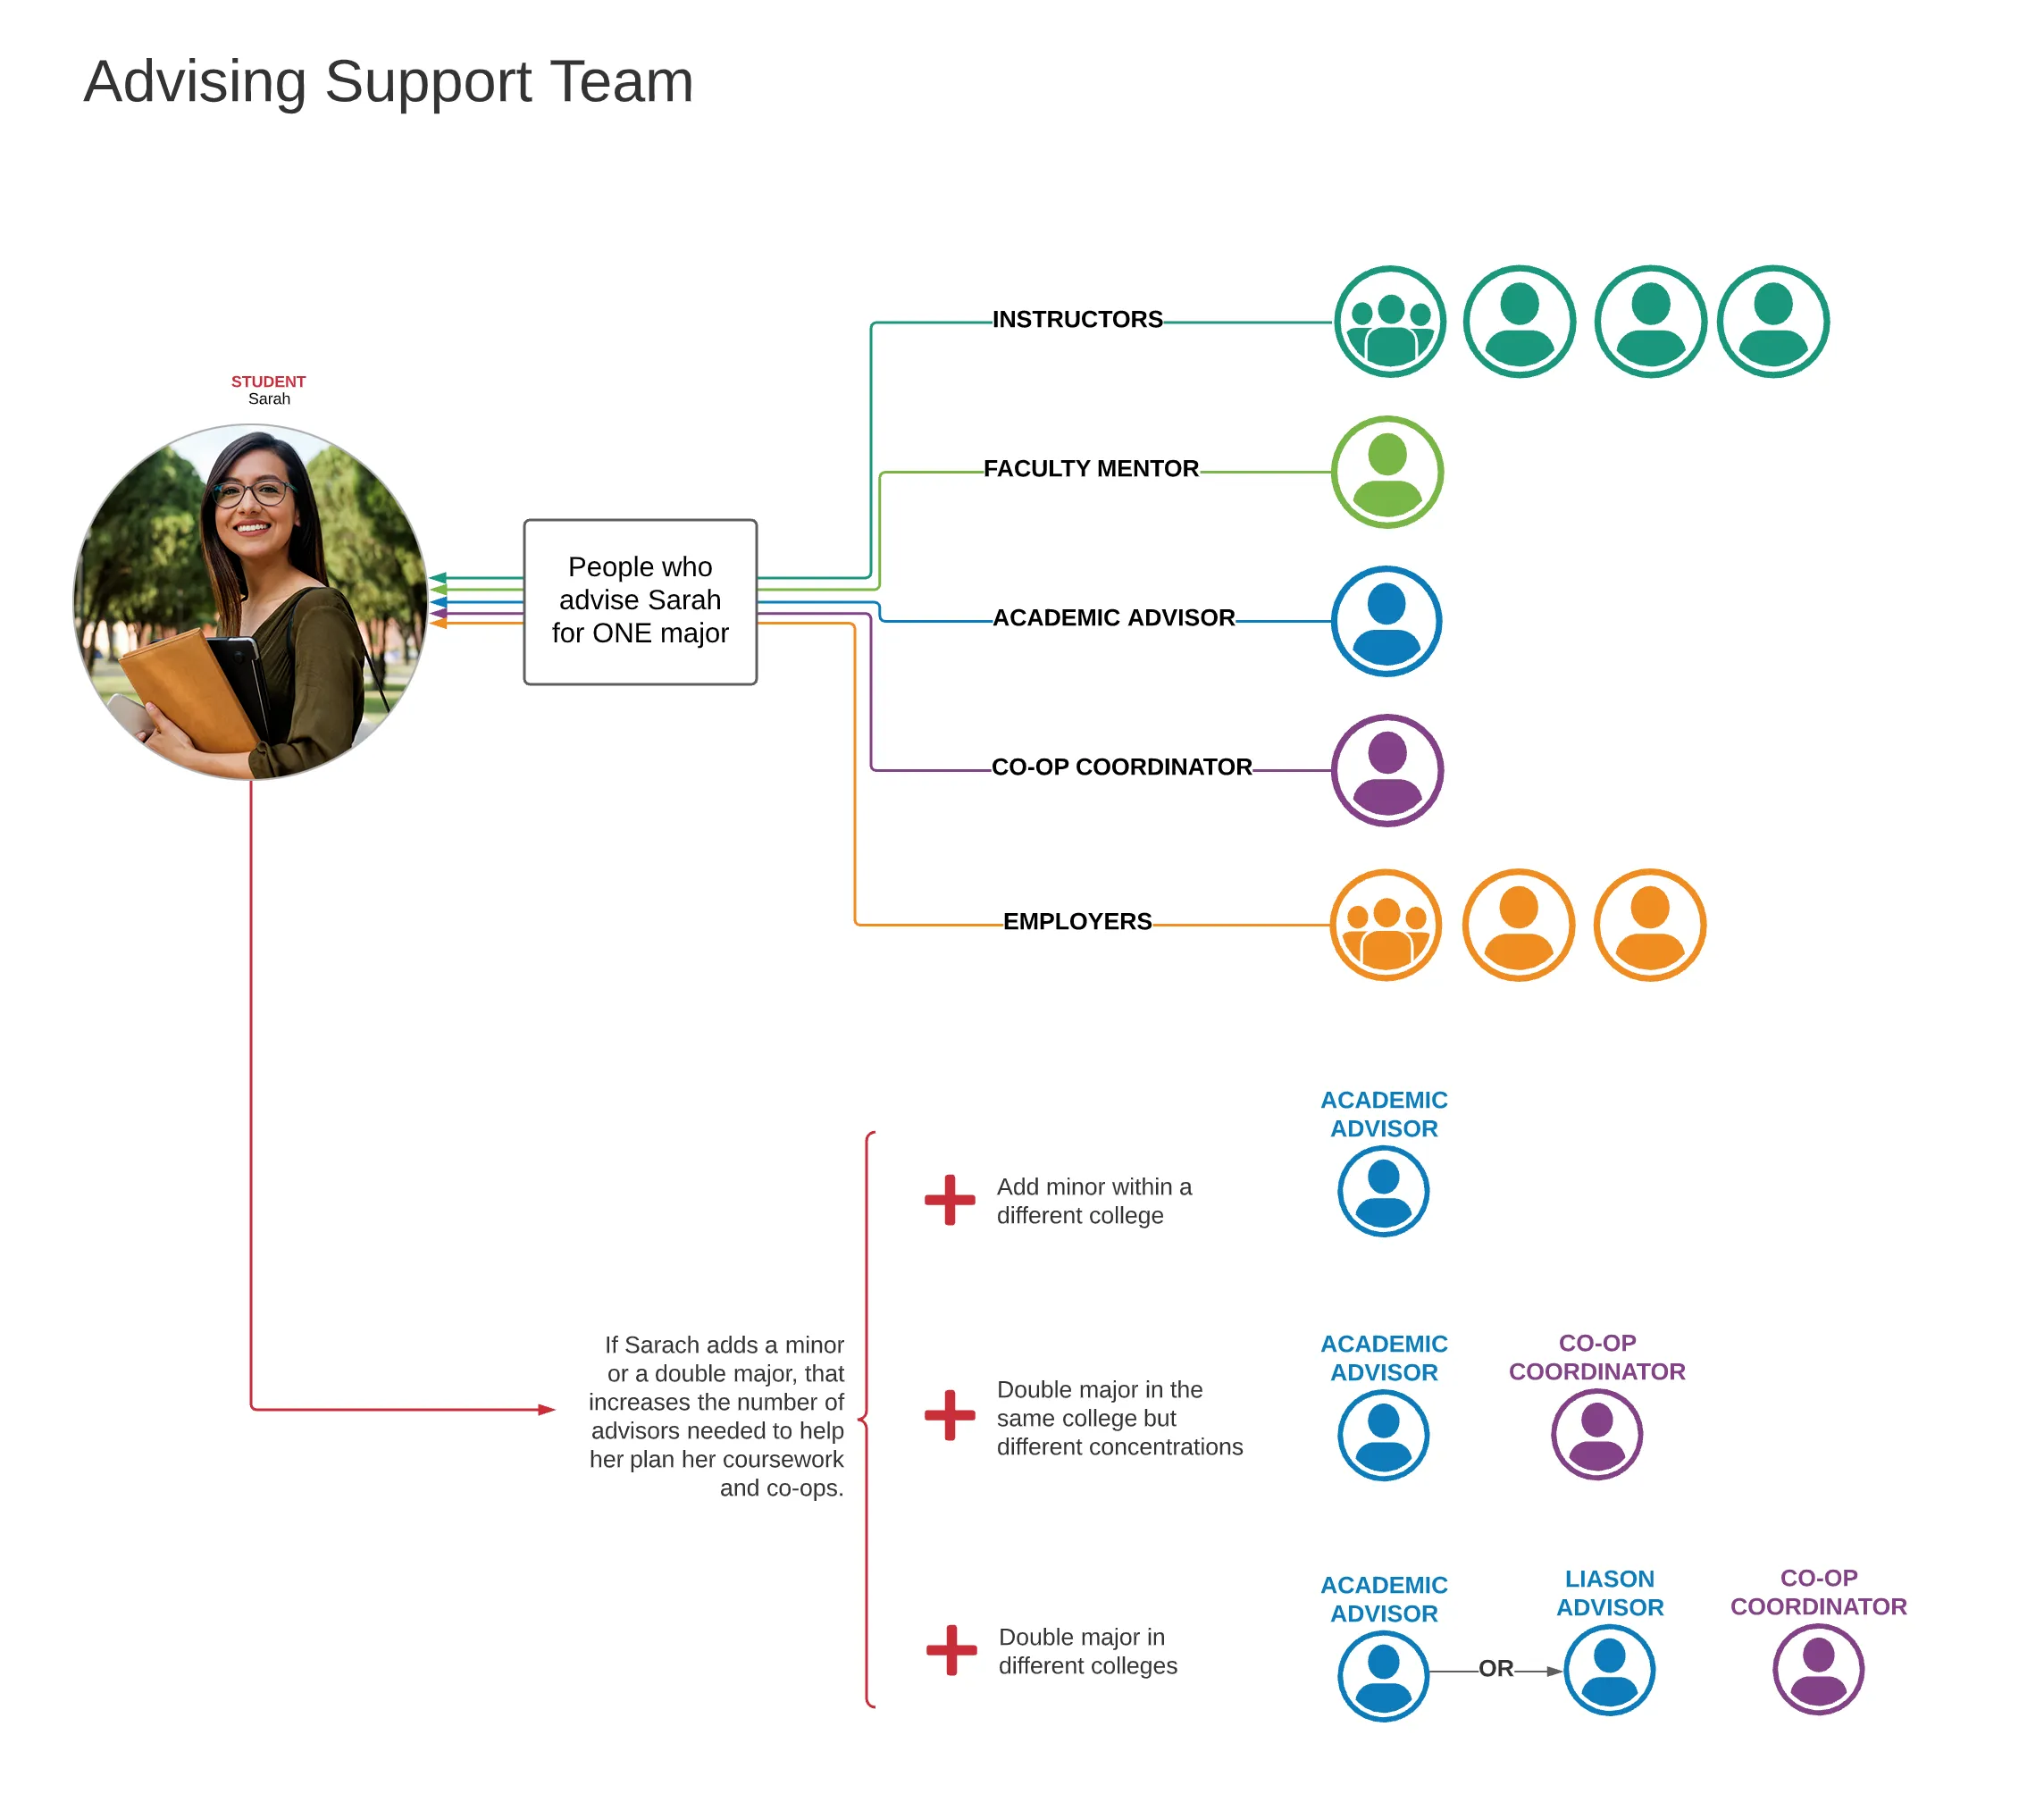
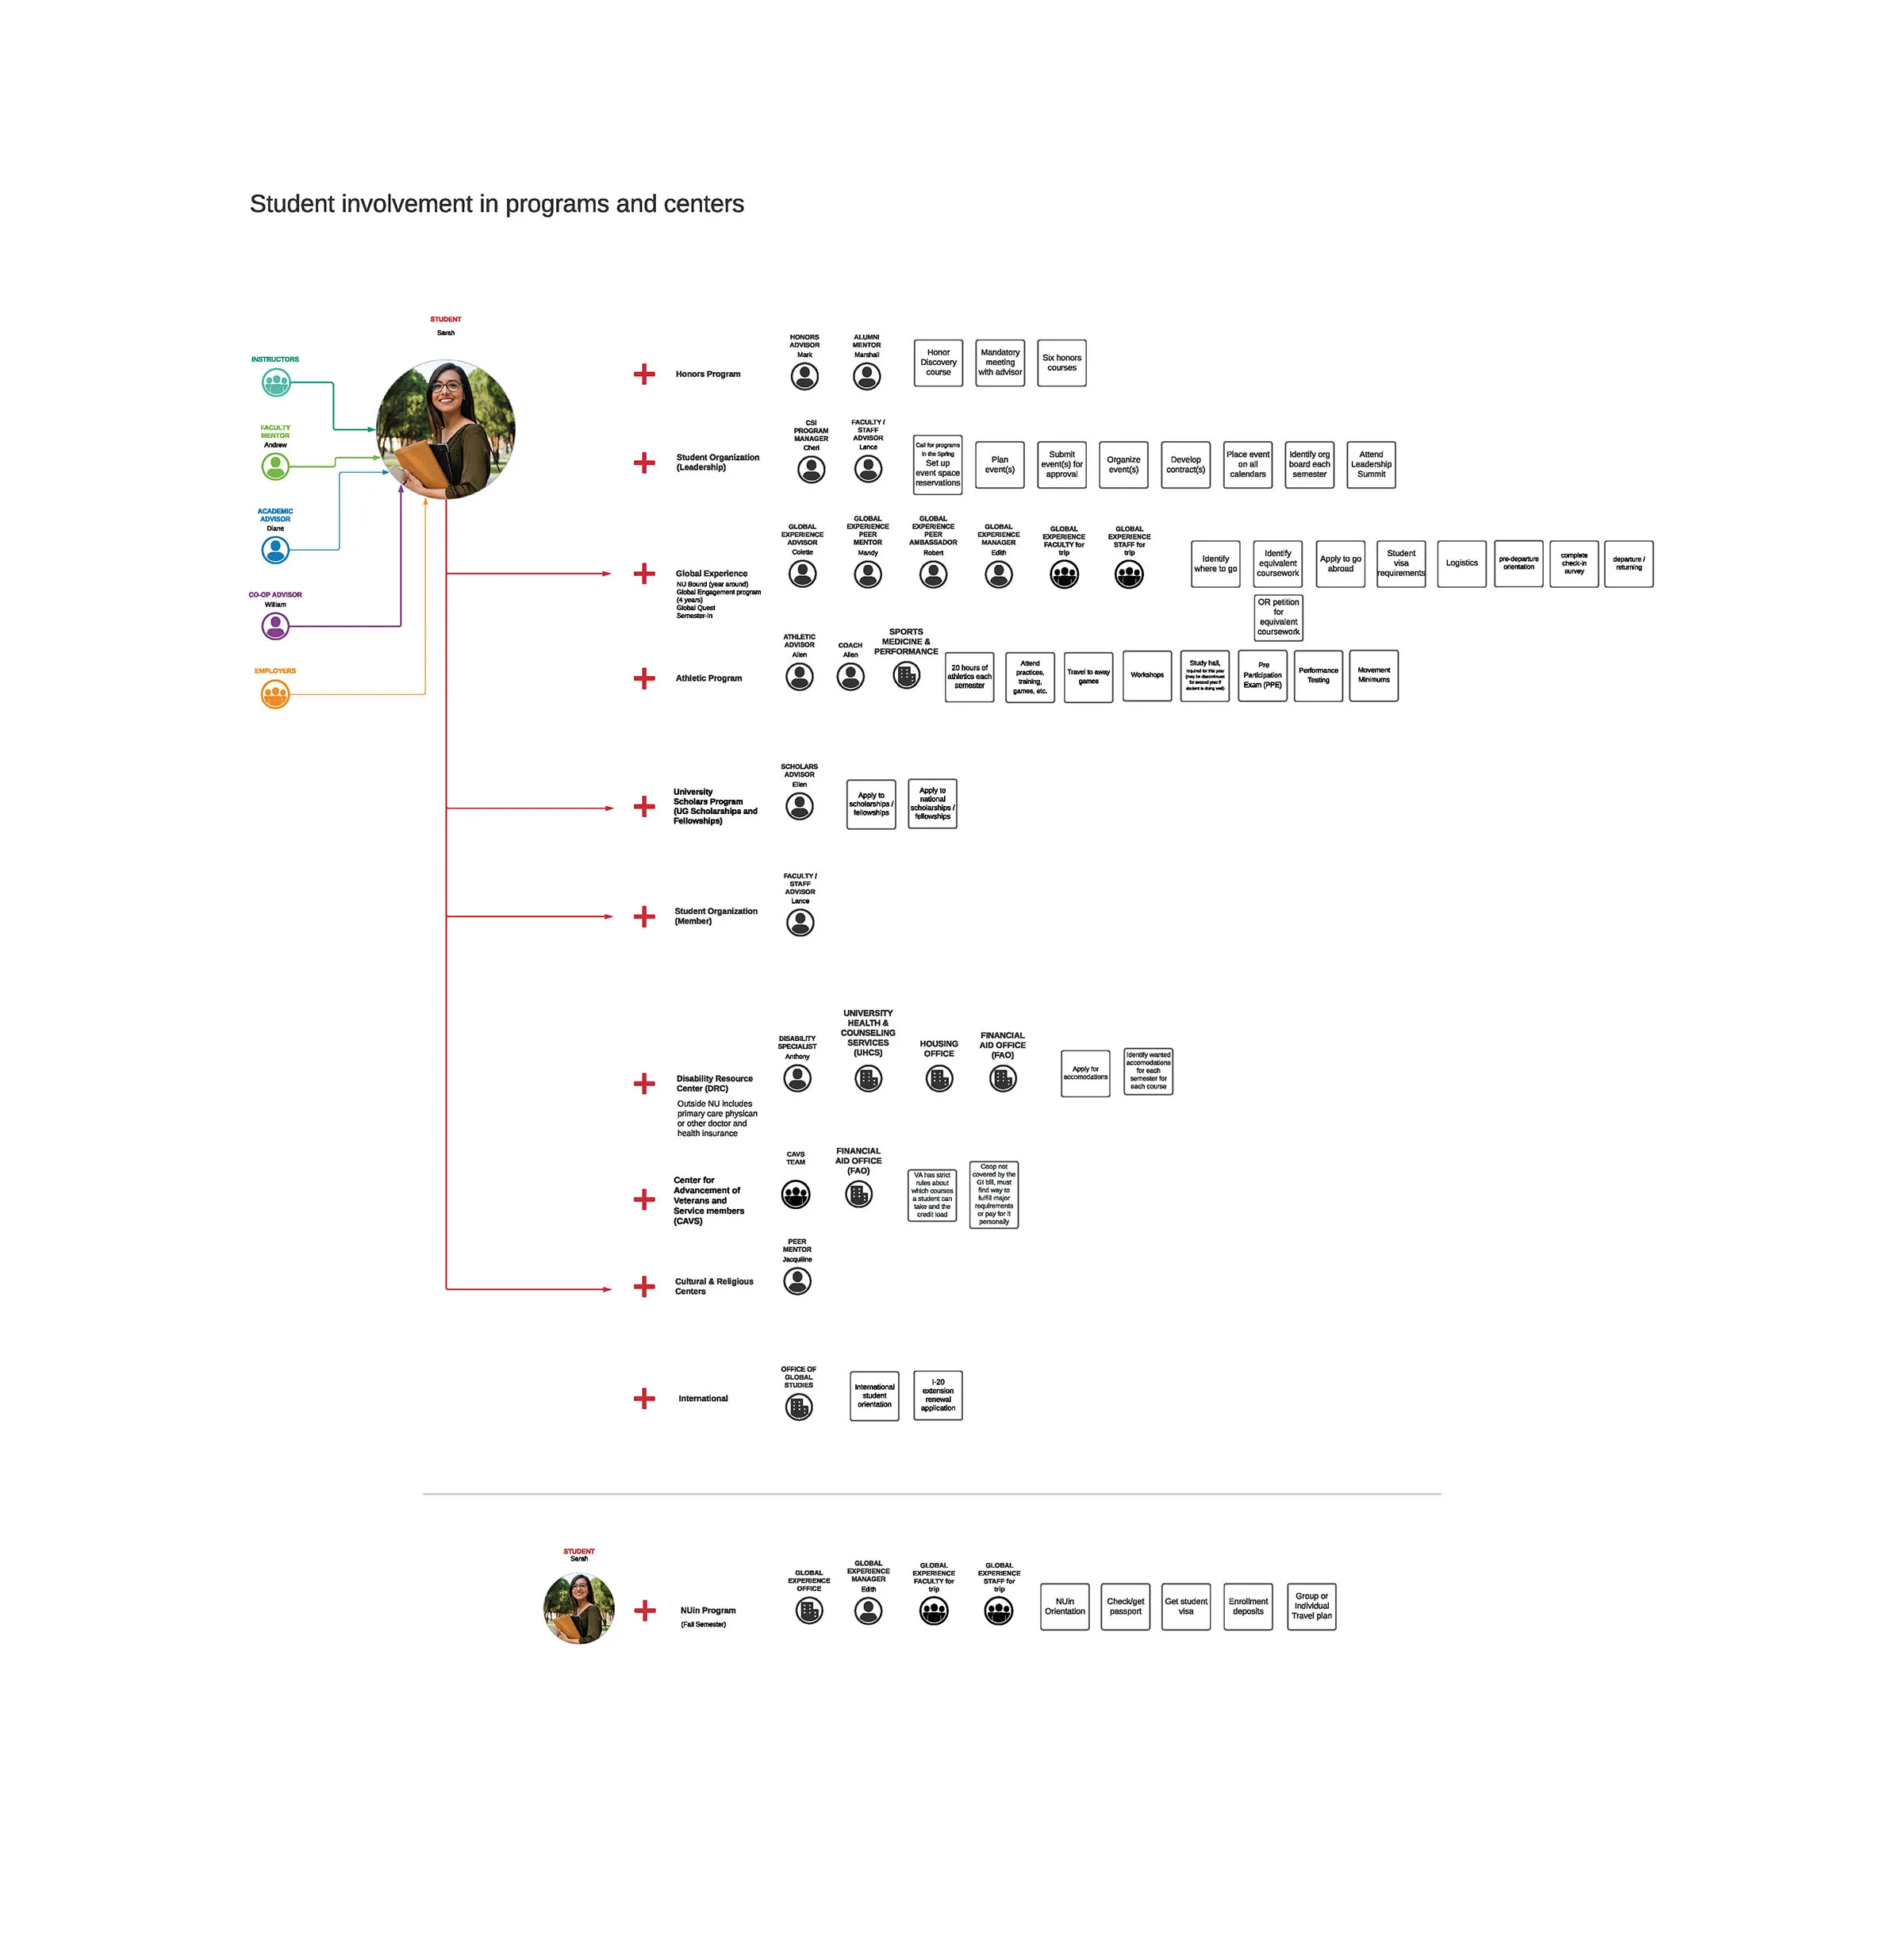
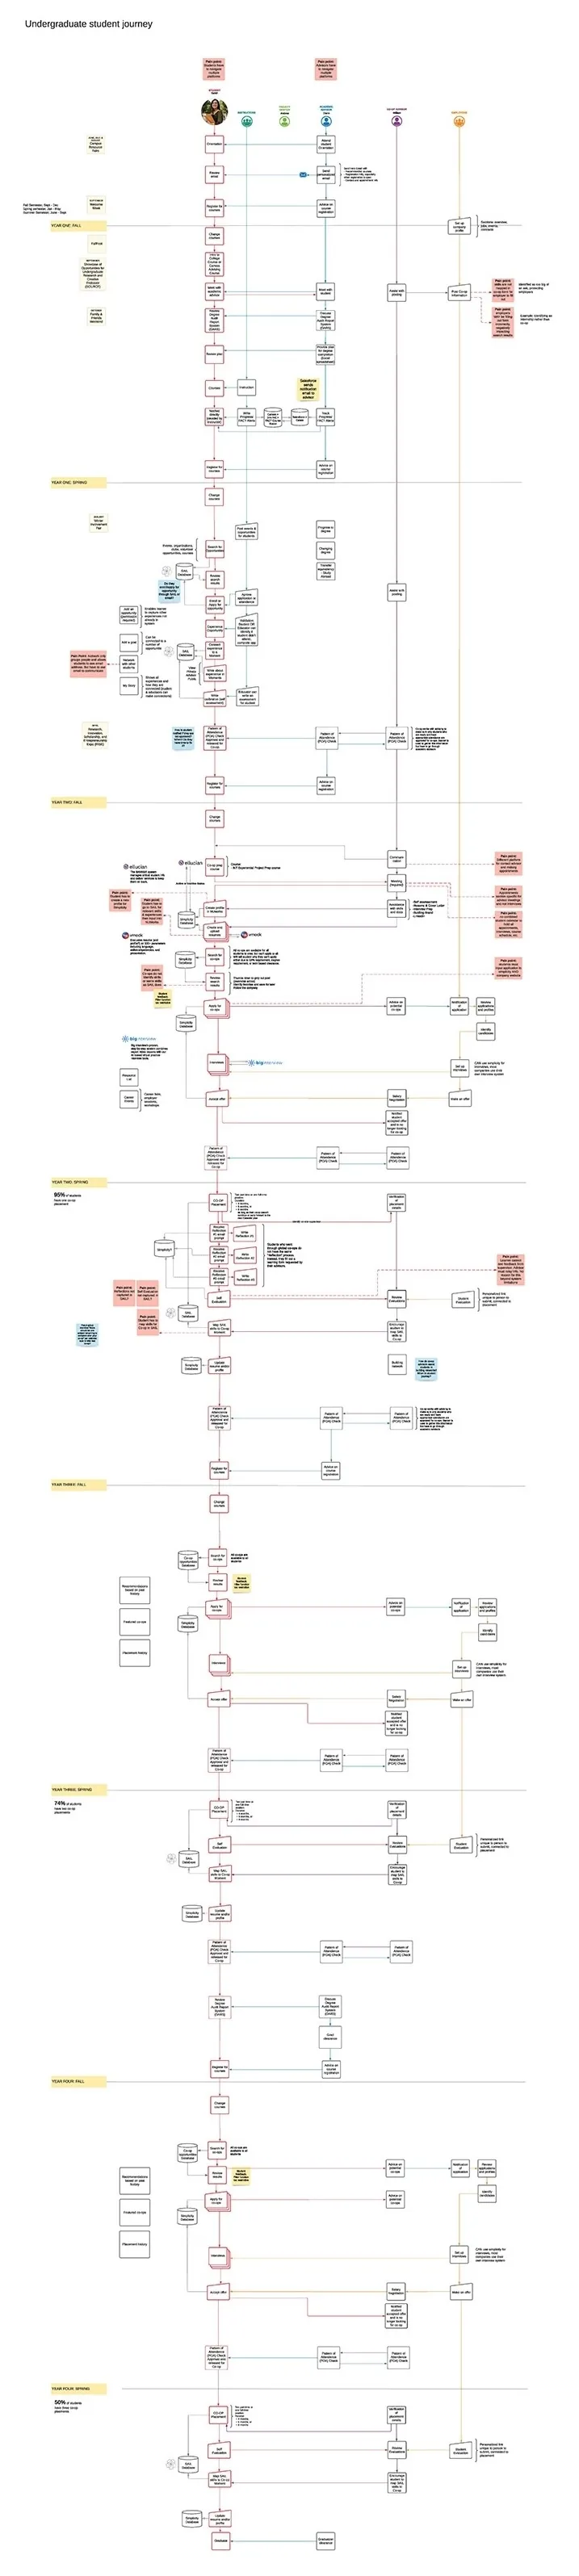
I created the student journey map not only because journey maps are standard UX practice, but because I recognized that this specific audience needed to see the student experience laid out end-to-end — every system, every requirement, every advising touchpoint across four undergraduate years.
The sheer physical length of the map was itself the argument. I didn't need to explain the complexity when stakeholders could see it.
I didn't present raw research to stakeholders. I didn't use jargon — not because I couldn't, but because adding technical complexity would have given people a reason to disengage.
When findings are hard to hear, the delivery has to be simple enough that there's nothing to hide behind. I kept language straightforward, connected the dots explicitly, and let the evidence carry the weight.
I modified the presentation multiple times based on stakeholder feedback — not to dilute the findings, but to find the framing that preserved their integrity while making them actionable.
That balance — between being rigorous and being heard — was the hardest part of the engagement.
A 130-page report is documentation, not communication. I knew no stakeholder would read it cover-to-cover.
But the findings needed to be exhaustive for institutional reference — every discovery, every methodology decision, every data point documented so the university could return to it for years.
I decided on a two-layer delivery strategy.
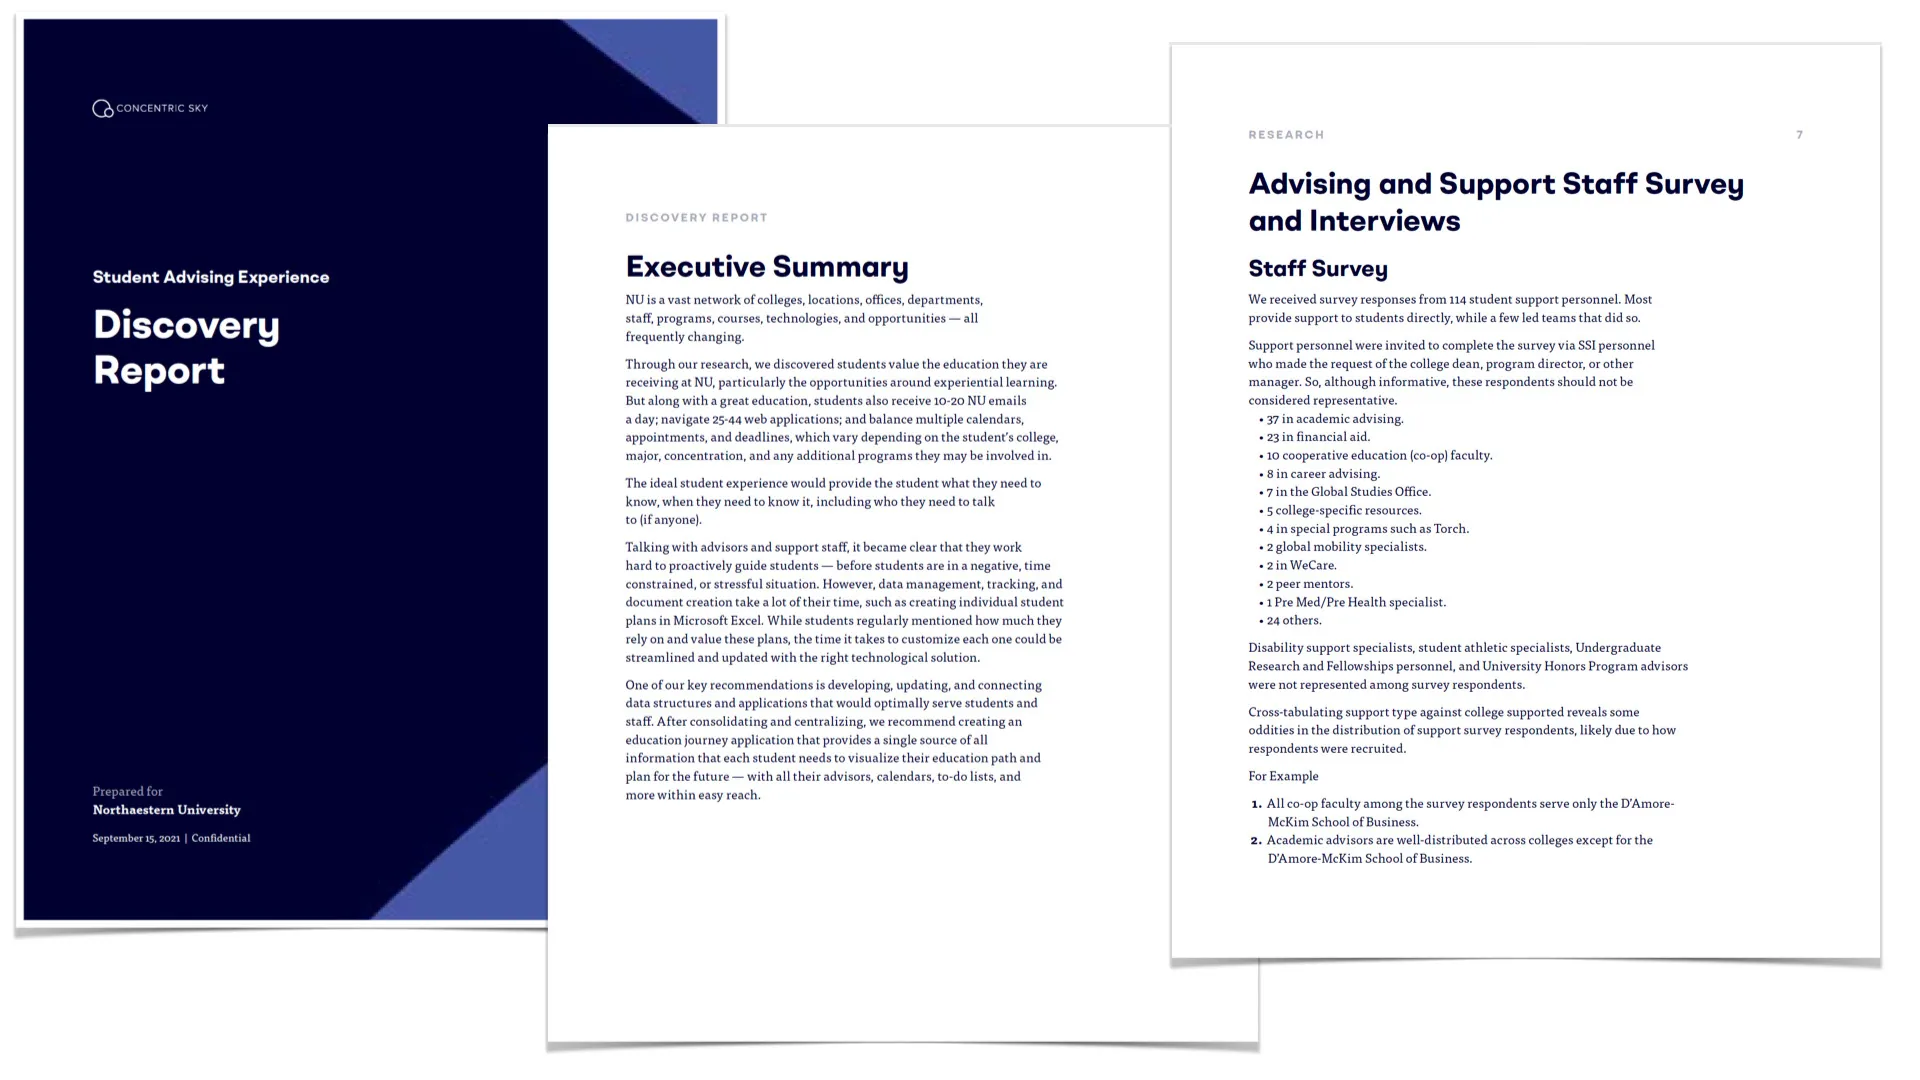
A Discovery Report — edited to 102 pages with client feedback and our content strategist — served as the authoritative record: an executive summary, research methodology, a detailed report of findings, 55 specific recommendations mapped to specific discoveries, 7 holistic solution concepts, and a strategic action plan.
This was the reference document.
For decision-making, I built a presentation that distilled the actionable points.
Two artifacts, two audiences, one coherent story.
I developed all the content and worked with the design director to create branded, visually compelling slides. The content strategist ensured consistency between the report and the presentation — so stakeholders who read both would never encounter contradictions.
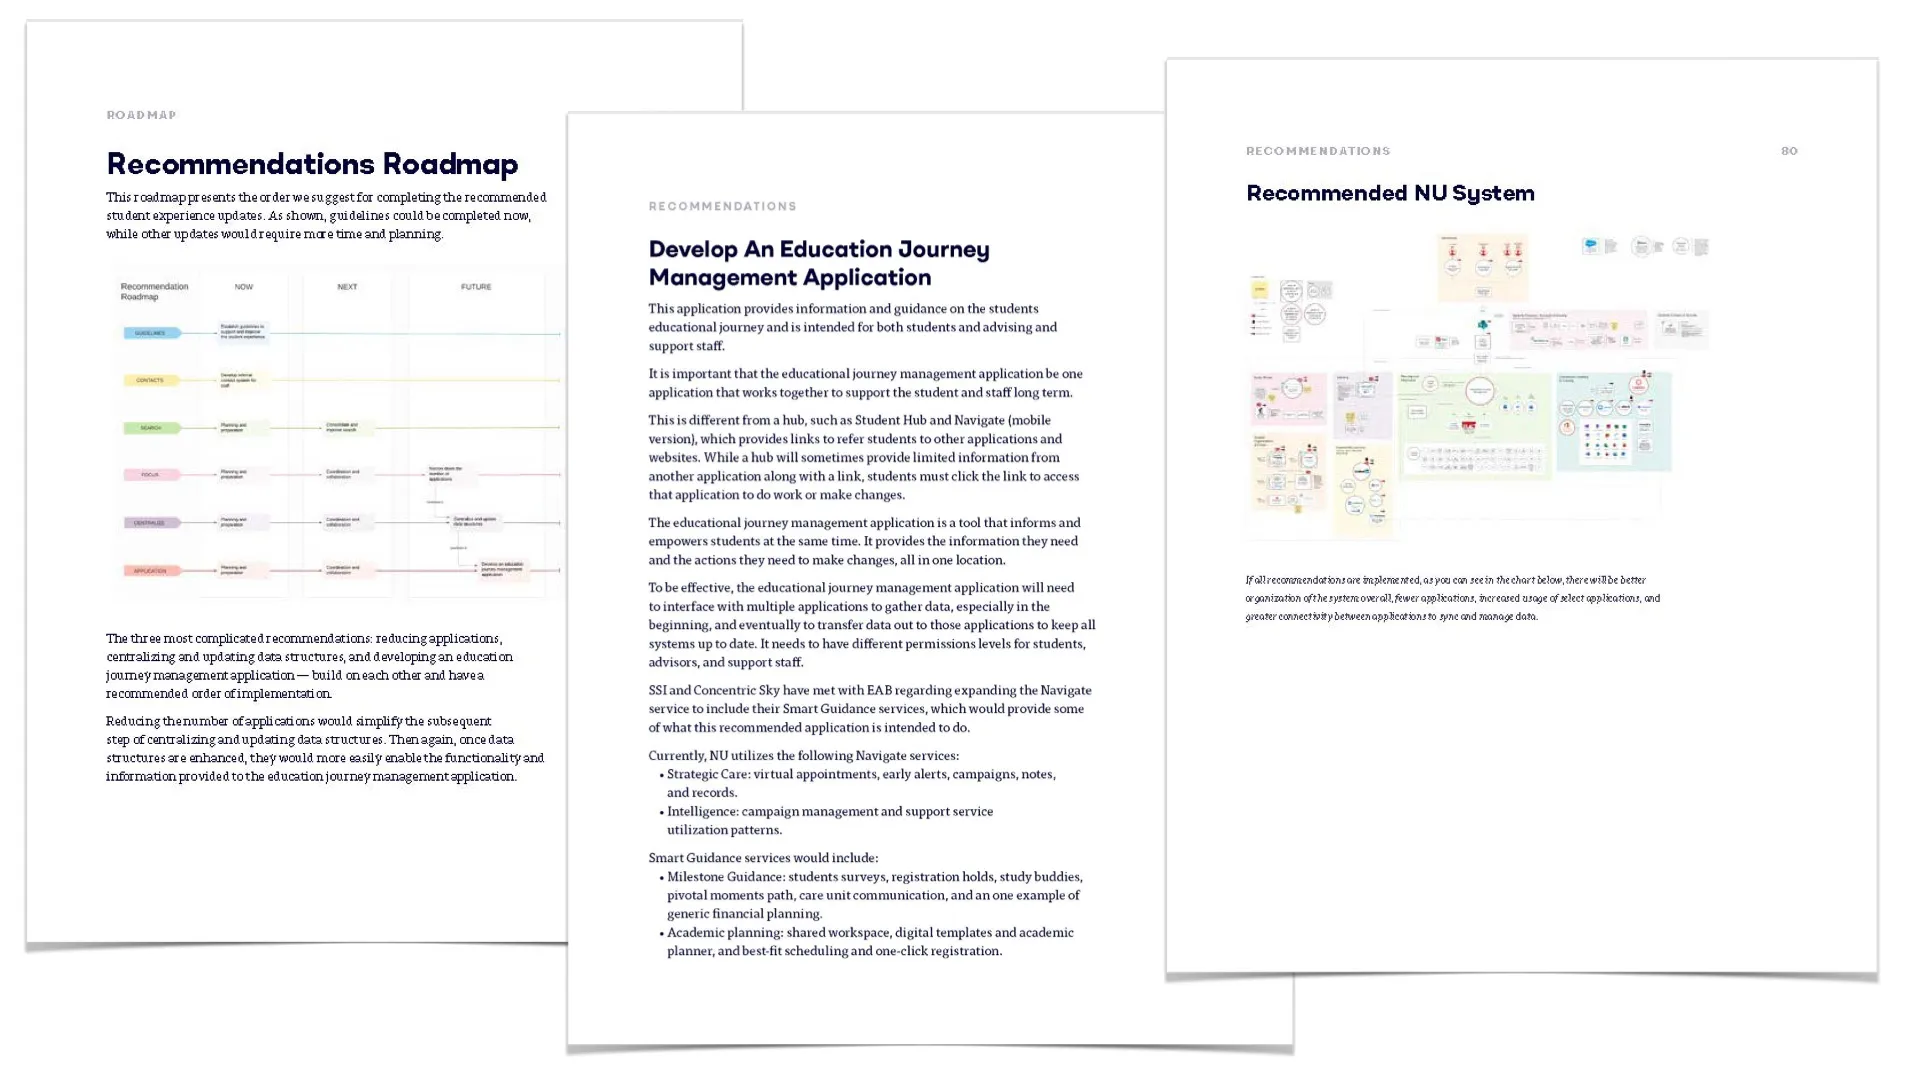
The 55 recommendations weren't a flat list. I designed a strategic action plan — a sequenced roadmap where each recommendation builds on the previous one without causing operational disruption.
For instance: consolidate data infrastructure and server architecture before building a new student-facing mobile application — because the app depends on clean, connected data. Skip that step, and you're layering a new tool on top of the same fragmented system that created the problem.
That sequencing is what turned research into something the institution could actually execute. Recommendations without an implementation order are a wishlist.
An action plan gives leadership the confidence to move.
I presented to multiple stakeholder groups across the university — Vice Chancellors, Deans, IT leadership, the Education Innovation team, and the Student Support Initiative.
Each presentation connected the dots between what the research uncovered, what it meant for their specific domain, and what they could do next.
Two applications were changed as a result of the report.
A new peer-support mobile application was initiated for freshmen — an idea that originated in the strategic action plan as one of the 7 holistic solution concepts. The university's Education Innovation team repurposed an existing application to meet the need for peer advising and mental health support during the critical first year.
The Student Hub — an internal portal that had been linking students out to find data — was restructured to pull information inward. The research had shown that outbound links broke silently; staff never noticed because they didn't use the student-facing interface daily. Students encountered dead ends constantly.
Northeastern brought me back to lead three additional research projects — each building on the foundation and relationships established in Discovery I.
The engagement generated over $500,000 in contract work for Concentric Sky and created a new applied-research revenue stream for a company previously known exclusively for application development.
The contacts, proposals, and follow-on work demonstrated that rigorous research could be just as profitable as building products.
If I were to do this engagement again, I'd push earlier for direct observation sessions — watching students navigate the ecosystem in real time rather than relying entirely on interviews and surveys.
The journey map and systems chart were powerful proxies, but nothing replaces seeing a student toggle between six applications to complete a single advising task. ▪️
All work © Jayna Bergerson unless otherwise noted.